Scan log
The scan log records what happened to each page during the most recent full-site scan. It updates live during a scan and is restored from the database when you reload the dashboard.
What it shows
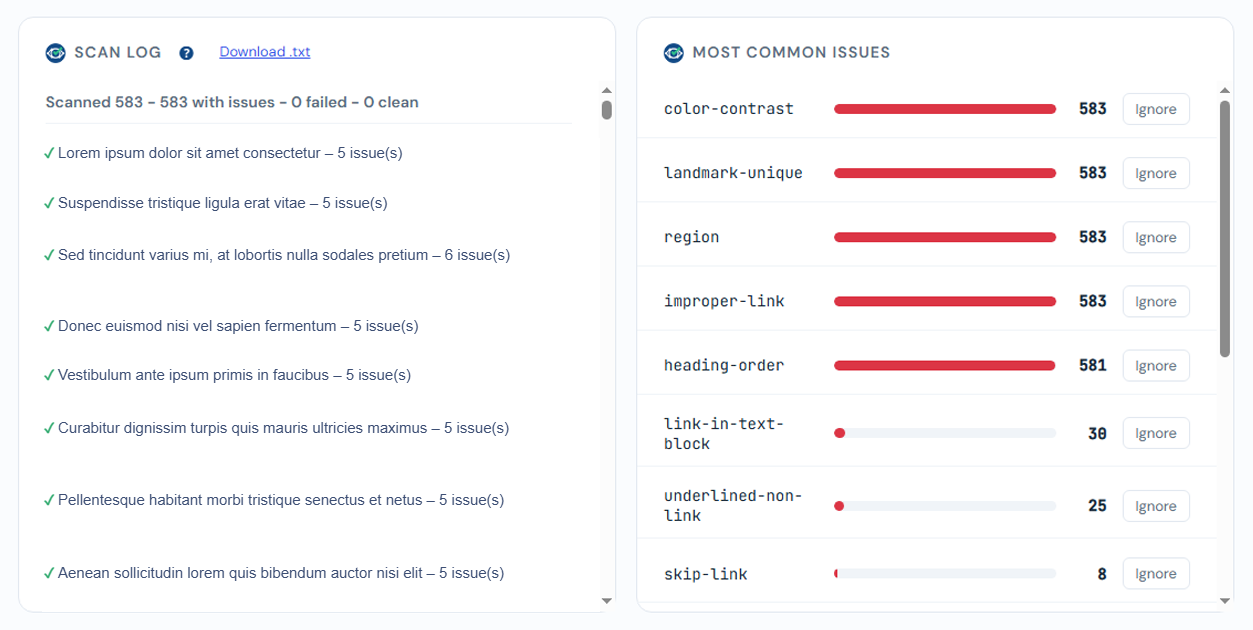
- A running counter: scanned / with issues / failed / clean.
- A line per page with issues or failures (clean pages are counted, not listed, to keep the log readable on large sites).
- A check mark for a page scanned successfully, an X for a timeout or failure.
Download as .txt
Click Download .txt to export the full per-page log, grouped by category (with issues, timed out, save failed, skipped), including the scan date and how long the scan took.